How To Invest

A Beginner's Guide to Investing for Retirement


Begin Learning


Disclaimer: This guide was not created by a finance professional. It was created by a medical doctor with a passion for evidence and finance. This guide was designed to help others start investing logically for their future as well. The material found herein is for educational purposes only and there is no guarantee as to its accuracy.

Importance of Investing


You (hopefully!) have a job and are making money. You may have some extra money if you're careful with your spending habits. There are a few options for what to do with this extra money. You could put it under your bed, or you could park it somewhere else. There are two problems with the bed option: 1) inflation and 2) lazy money.

Let's talk about inflation first. Inflation means that your money actually loses value as time goes on. Remember when a can of Coke was a buck and now it's a $1.50? That's inflation at work. A dollar was good for a whole Coke a few years ago, but now it's only good for 2/3 of a Coke. If you kept your money under your mattress for 10 or 20 years, the purchasing power (i.e. how many Cokes you could buy with the same dollar) would continue to go down. In the past two decades, inflation in the US and Canada has averaged 2% per year. Meaning that if a Coke cost $1 one year, it would cost $1.02 the next and, in 20 years, the same can would be expected to cost $1.50.

Now let's talk about lazy money. No one likes being lazy, and you shouldn't want your money to be lazy either. Money can do work for you. It can do this work by being invested in financial assets like stocks or bonds. We'll talk about what these are later, but the main point is that money can be put somewhere else other than under your mattress so that it can grow at a rate that's higher than inflation, and hopefully even more than that.

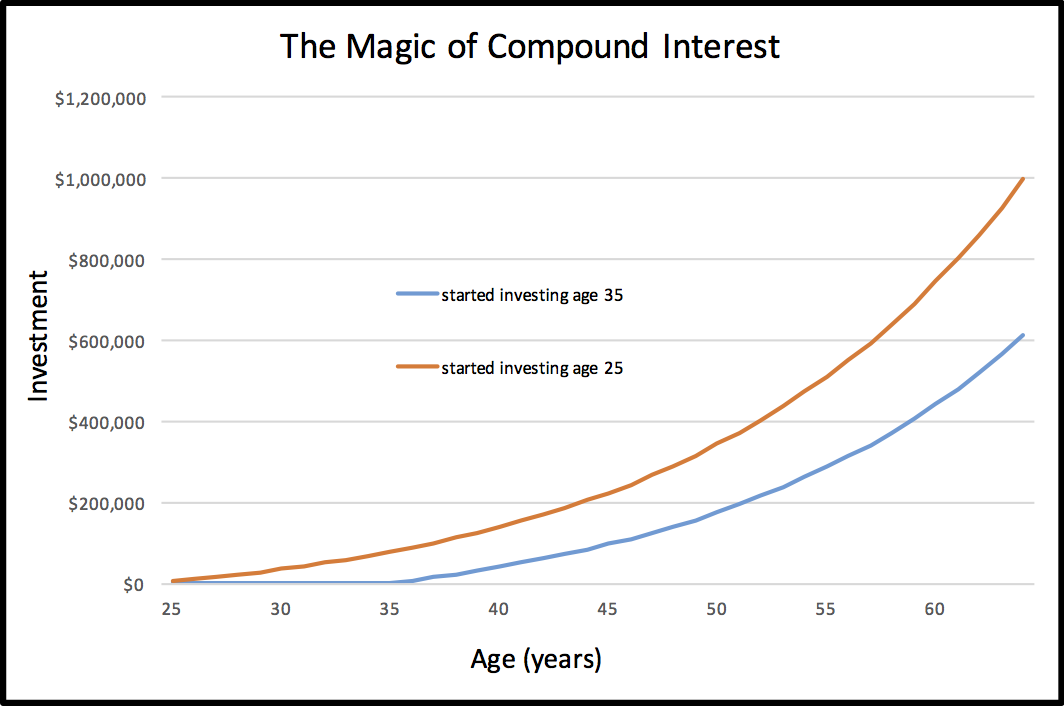
To make this money grow as fast as possible, it's important to start investing as soon as possible. This is because of the magic of compound interest: money that has has been invested longer will make you more money. For example, the graph below shows the investments from two individuals, one who started investing $5,000 per year at age 25, and the other who started investing $7,000 per year at age 35. We assume that they made 7% per year on their investments. Each invested almost exactly the same amount; however, as you can see, the one who invested earlier has almost double the amount of money when they are both ready to retire at age 65.

compound interest

Why invest in the first place though? Why not use all your extra money to buy chocolate or gold-rimmed lamp shades? Sure, you could do that, but some people would like to retire, and having the option to retire earlier is a nice thing to have. This concept has sexy acronyms like FIRE (for Financial Independence Retire Early) and is taking over the blogosphere. By making your money grow as fast as possible, you can retire earlier than if it just sat around with your lost socks.


Investment Strategy Overview


"Investing" sounds scary to some people. Stock market crashes. Photos of people in the 20's jumping off buildings right? Why not be safe and park it in a bank savings account, or, better yet, give it to a financial advisor and let the expert tell you where to put it?

Let's first talk about the "expert" option. This is a potential route for some people who have difficulty with, or can't be bothered with finances. The problem is some investment advisors can have conflicts of interest. They may recommend investment assets with higher under-the-hood fees because they get a kick-back from these fees. For example, Scotia Bank (a Canadian bank) offers an index fund (a collection of stocks - more on these later) of the Canadian stock market with an annual management fee of 1.00% while TD Bank (another Canadian bank) offers a similar fund for 0.33%! An investment advisor will probably recommend the investment offerings of their own institution, even if better prices for similar results can be gained elsewhere. Why do 10ths of a percent matter? Even a sliver of a percent lost, when accumulated over decades, will significantly affect how much you have when you retire. The graph below shows an individual investing $5000 annually into the same investment that earns 7% annually but with increasing fees. As you can see, if you chose the 1% vs. 0.1% investment, you would have lost out on about $200,000 at retirement age.

affect of fees on income

You may also be wondering: what do I know about buying something like stocks? Shouldn't I trust someone who does? This will become clearer later, but very strong research has shown that "expert" stock pickers, historically, have done no better than you can do, except that they take a fee.

So what's wrong with a savings account? Nothing really, except that you could be getting better bang for your buck for just a little bit more effort. The bank is able to give you a 1% return because they are putting that money in places that earn even higher returns. These other places aren't secret. And if you're willing to go the extra mile, you can do the same.

So where are these places you should be putting your money? Broadly, you can put your money into stocks and/or bonds. In the following sections we will talk a little about what exactly these are and how to invest in them. First, however, we need to talk a bit about the concept of risk.

How to Measure Risk?


Risk, simply put, is the chance that something other than the expected will occur. For example, we usually expect it to snow in Calgary, Canada in the winter. If one were to bet on whether it would snow or not the whole winter season, it would be a very safe bet that it would snow at least once. This is a very low risk bet as we are almost 100% sure, based on historical records, that it will snow at least once each year.

Let's look at the risk of something a bit more complicated. Below is the distribution of snowfall per year in cm over the past 25 years for Calgary, Canada.

annual snowfall

The most common annual snowfall is within the range of 120-170 cm. However, we also see that snowfall varied significantly from year to year, making this a risky thing to bet on. We could not bet for certain that snowfall would be between 120 and 170 cm every year. In fact, there is a 46% chance snowfall would be outside this range in the coming year if history were to repeat itself.

What does this all have to do with finance? Investments also have risk. Your aim should be to choose an investment with a good expected most common return, but with a low amount of expected risk. Investments with higher risk are dangerous because, while they do have the chance to make a lot more than their most common value, you could also make nothing at all. The higher the risk of an investment the more you start to gamble, and no one should gamble with their future.

When comparing investments, how can we figure out which gives the best return with the lowest risk? One way is by looking at the 5th percentile. The 5th percentile is the value above which 95% of all the other possible values were found. For example, in our snowfall example, the 5th percentile is at about 70 cm. This means that you could be 95% sure that snow will fall above 70 cm in the future if history were to repeat itself.

Below you can see the historical performance of two hypothetical investments. Which should we buy? You might be tempted to buy Investment A as it has a higher most common return. Notice, however, that the spread of the possible values for Investment A is much wider than Investment B, making it a lot riskier. This results in Investment B having a higher return most of the time and a higher 5th percentile. Therefore, it's safest to invest in Investment B because, 95 times out of a 100, it will do better than Investment A.

5th percentile

One last thing you should also be aware of is the significant limitation of using historical data to make predictions for investments or anything else, as history may not necessarily repeat itself. In terms of our snowfall example, global warming may change the amount of snowfall in the future, influencing how much we can rely on past events as an accurate reflection of future snowfall patterns.

In the next two sections we will talk about places you can put your money - stocks and bonds - as well as their expected risk.

Stocks


When you buy a stock in a company you purchase a little piece of that company. How much that little piece costs will depend on a few things: how good that company is currently doing and how good people think that company will do in the future. To illustrate the last point, let's imagine that Coca-Cola was about to release a new soft drink that people thought would be incredibly addictive. Coca-Cola's stock price might go up to reflect this expectation, even before the drink was on the market. This contribution of future expectation into a stock's price can make them unpredictable. If Coca-Cola's new drink doesn't actually do as well as as predicted (how can one really know how well a new fangled drink will do?), the stock might plummet. This factor likely explains the huge amount of risk involved in purchasing a single stock. Take Coca-Cola itself for example. Below is a histogram of annual returns of Coca-Cola stock from 1966 to 2015.

annual returns, Coca-Cola

As you can see, while the most common return was between 0 and 10%, this varied widely from a low of -43% in 1974 to high of 60% in 1995. A huge variation, and, likewise, a large expected risk if you were to buy Coke stock today. Based on history, you have a 1 out of 4 chance of experiencing a negative return on your investment after a year.

This risk isn't just seen with Coke. Historically, any single large-company stock in the US stock market has a most common annual return of 15-20%, but any given stock's return can vary so much that you can still expect a negative return about 25% of the time over any given year. You may be wanting to shout: "But what about this awesome stock I read about! It makes [insert product here] and everyone is gonna buy them in a few years. Aren't I guaranteed an amazing return if I buy this stock?". Perhaps your company will in fact make an amazing product; however, this expectation is known to everyone else who is eyeing this stock as well, and is already built into its stock price. The only way to truly make a killing on a single stock is to know something before other people do. And unless you're doing something illegal (i.e. insider trading), this is unlikely.

Does this mean you shouldn't buy stocks? Absolutely not. But you should avoid buying a single stock, unless you want to gamble. There's something really interesting about the stock market: if you buy many stocks in different types of companies at once (this is called diversification in finance), you can still achieve a good most common return but with lower risk. Found in the same Coca-Cola return chart are the annual returns of the S&P 500 Index (a collection of 500 big stocks in the US stock market) from 1966 to 2015. The most common return is a bit higher than Coca-Cola's at between 10% and 20%, but, more importantly, the risk of being much higher or lower than this range in any given year is less, giving it a higher 5th percentile return (-19% versus -22% for Coca-Cola) as well.

How does diversification lower risk? Intuitively it makes sense: Are you going to bet that people buy more Coke in any given year or would you rather bet that the entire US economy is going to grow instead? The same concept applies when broadening a stock portfolio by investing internationally: if you add international stocks to a US portfolio, risk is reduced even further.

One last magical aspect of stocks that must be mentioned is that their annualized risk decreases the longer you hold onto them. There may be a big stock crash during any given year, but the market, historically, has always recovered. If you continue holding onto that collection of stocks over 20 years or more, it's almost as if the crash didn't happen at all. In fact, average annual total stock market returns (adjusted for inflation) have clustered within a few percentage points of each other if you analyze them over any 30 year period since 1926. This trend is shown on the histogram below, where we compare average annual returns of the S&P 500 over all possible 10, 20 and 30 year periods (increasing a month increment at a time) from 1926 to 2015.

annual returns, MSCI USA over different time horizons

If this concept still seems confusing, try looking at this chart of the US stock market over time. Notice that it's possible to lose money or make very little money if you only held onto stocks for a few years; however, in the long-run, the stock market always rises.

In summary, if you're going to choose to invest all your money in stocks, you should invest in a broad collection of stocks and be willing to hold onto them for 20 years or more before cashing out. This is the only way you can be reasonably certain of obtaining a positive return on your investment.

Important Note #1: You may have noticed the term "Total" Return in the histogram above. What does this mean? Stocks usually make you money in more ways than by increasing in price. Many stocks pay dividends, which are basically a cut of the company's profit paid out to shareholders. Total return accounts for these dividend payments by assuming that, whenever dividends were paid out, they were immediately reinvested by buying more of the same stock. If you invest in the stock market, you should reinvest the dividends you receive as well. You shouldn't have cash sitting around as lazy money for very long.

Important Note #2: Is it possible to beat the performance of the stock market as a whole by betting on specific stocks other than through plain luck? Conceivably. But, very smart people (one author is a nobel laureate) have looked at the historical performance of investment managers' portfolios (people whose job it is to invest money). They show that a sizeable proportion of money managers underperformed the overall stock market AND the proportion of money managers who outperformed the market, in excess of fees, was no more than that you would expect than by chance. Incredible.

Bonds


At their root, bonds aren't that hard to understand. When you buy a single bond, you are lending someone or some entity money. Terms of this loan will differ but will always have three characteristics: 1) how much money you are lending 2) the interest rate that will be paid on that loan and 3) when the loan agreement will be complete, or reaches maturity. For example, let's say you purchase a $1,000 bond with an annual interest rate of 3% and a maturity of five years. You will loan $1,000, and, in return you will be paid $30 a year for five years at which time you will be given the $1,000 back.

Simple, right? However, where bonds get a little bit complicated is that you can actually sell bonds before they reach maturity. Let's say you bought that same $1,000 bond, but a year in you lose the rest of your money buying gold-rimmed lamp shades and now need your money back. You can sell that bond to someone else, but they might not want to give you the full $1000. Why not? Imagine that when you want to sell your bond, 4-year bond interest rates have now increased to 5%. You would have to offer to sell your bond at a discounted price of $928 to make up for the fact that it will only be paying 3% for the four years remaining until the bond matures.

You don't really need to understand the math of how we arrived at the sell price: the big point you need to remember is that even though bonds are thought of as a "stable" investment because they pay a fixed interest rate, bonds can underperform for reasons other than rising interest rates: 1) the interest rate of the bond you bought for becomes lower than the current rate of inflation 2) the entity that issued the bond goes bankrupt and you lose both the value of the bond and all remaining interest payments.

Bonds come in a few different major flavours, but the ones that should concern you are primarily government or corporate bonds. Within these categories you also need to think about ultra-short (< 1 year), short (1 - 4 year), intermediate (5 - 9 year), or long (> 10 year) maturity. These flavours will determine just how risky a particular bond is. Bonds issued by a government, especially a stable government will have lower interest rates than bonds issued by a corporation because a stable government, like the USA, is much less likely to go belly-up and not repay its loans. Bonds of longer maturity will need to offer higher interest rates than shorter term bonds to account for the possibility that interest rates and/or that the rate of inflation may rise in the future. Both possibilities make long term bonds more risky.

You can observe the difference in annual rates of total return (this means, if you had a 10 year bond, you sold it after a year, reinvesting any any interest payments along the way) for US government bonds of varying maturities in the graph below.

annual returns, different types of bonds

As you can see shorter versus longer government bonds have a reduced risk at the expense of lower returns. So which should you buy? Long or short bonds, corporate or government? This is a complicated question and depends on if you want to buy stocks too, as well as your investment timespan. We'll discuss this in the next section.

Two last points that should be mentioned before we move on. First, bonds, unlike stocks, do not become significantly less risky the longer you hold onto them. Second, buying a collection rather than just one doesn't make as much of difference for bonds as it does for stocks; however, practically speaking, purchasing and especially selling a collection of bonds is a lot easier.

What to Choose?


So what should you invest your money in, stocks or bonds? Simply put, stocks, and let's explain why. If you're young, you probably have more than 20 years to invest your extra income before you retire. Over long timespans, stocks have earned much higher returns than bonds. For example, the S&P index from 1926 through 2015 averaged over all possible 20-year timespans earned 7.2% annually adjusted for inflation. By comparison, US treasury bills (30-day maturity), intermediate-term treasury bonds (5-year maturity) and long-term treasury bonds (20-year maturity) earned 0.3%, 1.7% and 2.1% respectively. Historically, this has resulted in the fact that, 95 times out of 100, stocks have given the best return on your money when you hold on to them for long periods of time. This trend is shown below for 20-year holding periods with intermediate-term US government bonds representing bonds, and the MSCI USA and MSCI EAFE + Canada representing US and International stock respectively. Data was analyzed from 1970 to 2015.

iphone1

You can see that at the almost worst-case scenario (i.e. historic return at the 5th percentile), 100% diversified stocks gave the best low-end return of 4.5%.

Notice that we put 80% US stock and 20% International stock for our stock allocation. This allocation has been shown historically to have lower risk over any given 1-year period than just 100% US stock alone. What if you're Canadian? If you do similar calculations, the less risky allocation turns out to be approximately 30% Canada, 55% US and 15% International.

What if you're already retired or are planning on retiring soon?

The explanation is a bit more complicated but, all stocks should still do best. This is because you will still probably live more than 20 years, and, if you do some historic computer simulations (see here for Canada, and here for US) you can withdraw more money, on average, each year during retirement with an all stock portfolio over any 20-year timespan. In addition, if a few crashes happen along the way (as illustrated by the low-end curves on the graphs), all stocks still performs well. Again, this is all relying on history repeating itself-ish, so keep that it mind.

Now there are a few caveats that should be discussed about this approach. If you go all stocks in retirement, you should be prepared to experience large swings in the value of your investment. Such swings can also occur if you are not retired, but may be especially worrisome to the retiree who has no other income but their investment portfolio. Historically, a 100% stock portfolio can go down by over 70% during a crash. If you don't think you could stomach such a possibility, a bit of bonds in your allocation may be right for you. You can test out different bond allocation possibilities on end-worth and on biggest historical drop in value utilizing the historical simulator featured on the homepage.

What if you need your money in a few years. Say for a down-payment on a house?

Bonds are the place to be, with a bit of stocks sprinkled in. The best proportion of bonds to stocks will depend on your specific investment timespan. Below are graphs showing historical average and 5th percentile returns from mixing both ultra-short (i.e. 30-day), intermediate (i.e. 5-year), and long (20-year) government bonds with stocks (S&P 500).

image 1


For all timespans, mixing a bit of stocks with mostly bonds improves the average return and gives a better 5th percentile return up to a certain point. This point turns out to be about 5%, 5%, 35% and 45% stocks for the 1-, 2-, 5- and 10-year timespans respectively. Ultra-short bonds works best at the 1- and 2-year timespans. For 5- and 10-year timespans, it's unclear what the absolute best maturity is because, unfortunately, long-term historic data does not exist for many bond maturities (3-year, 10-year, 15-years etc.). We only have access to data for 5-year and 20-year bonds. 5-year bonds obviously trump 20-year bonds, and we therefore suggest choosing bond products that approximate 5-year maturities. There are two such products you can choose from: short-term (1-5 year) or intermediate-term (5-10 year) bond funds. Of these, we'd go with the short-term funds.

What about government and corporate bonds? Again, this will depend on your investment timespan. From the linked graphs, we see that corporate bonds are probably the best choice for 1-year, 2-year, 5-year and 10-year timespans, when proportioned with stocks as suggested above. (Long-term historic corporate bond data only exists for 20-year bonds, and this why they were used for this analysis. However, there is every reason to believe that the same relationship exists for intermediate term bonds.)

You may also be wondering whether diversifying bonds internationally will help reduce risk. I haven't done this analysis, but the good people over at Vanguard (a financial company) have, and they don't really. So it's probably fine to keep it simple and just invest in your own country's bonds.

Confused? Here's a summary table of our suggestions for stock and bond proportions for different investment timespans.

Timespan Bonds Stocks (Americans) Stocks (Canadians)
1-year 95% ultra-short corp. 4% US, 1% International 1% CA, 3% US, 1% International
2-year 95% ultra-short corp. 4% US, 1% International 1% CA, 3% US, 1% International
5-year 65% short. corp 28% US, 7% International 11% CA, 19% US, 5% International
10-year 55% short corp. 36% US, 9% International 13% CA, 25% US, 7% International
20-year 0% 80% US, 20% International 30% CA, 55% US, 15% International
30-year 0% 80% US, 20% International 30% CA, 55% US, 15% International

Ok so you now know where to invest your money, but how do you actually buy these stocks and bonds? Next section!

How to Buy Stock and Bond Funds


So you've decided how you want to invest your hard earned cash. We'll assume you have seen the light and will consider only buying collections of stocks or bonds. Extremely well-diversified collections of stocks and bonds can be found in two different types of products: an exchange traded fund (ETF) or a mutual fund. In each case a bank or company has bought many different bonds or stocks that sample a particular bond or stock index and bundled them all into a single product whose price reflects the underlying performance of these bonds or stocks.

There are many other index funds and associated ETFs including international, so-called "world" funds, bond funds and so on. In a few cases, such as index funds that track the S&P 500, the index funds actually own all 500 stocks exactly. But in most cases, the index funds consist of representative samples of the index being benchmarked to. For example, an index constructed by the Center for Research in Security Prices (CRPS) tracks the performance of more than 3,500 large, medium and small company stocks encompassing the US stock market, weighted by the size of the underlying companies. Vanguard, a US-based investment management company, markets an ETF, the Vanguard Total Stock Market ETF, that attempts to buy every single stock in this index using the same weights. Small differences arise because companies are constantly being added and deleted from the index. For example, at this writing, the CRPS index has 3,605 positions while the Vanguard ETF invests in 3,635 companies. There are competing indexes and associated ETFs, with some indexes only sampling large companies, such as the S&P 500.

How much you will end up paying for an ETF or mutual fund will differ, even if they are tracking the same stocks or bonds. First, you may need to pay a transaction fee to obtain the product. Second, all companies also take a little bit off the top for managing the fund (this is called the expense ratio, referred to the MER in Canada, and is taken as a percent of the product's price), which will reduce the expected return. Expense ratios can vary widely, from as little as 0.05% to more than 2%.

The final way where ETFs and mutual funds differ is where and how they are purchased. ETFs trade just like stocks on a stock exchange and are therefore available on any online brokerage platform. Mutual funds too can be accessed on many brokerage platforms, but because they aren't actually a stock, you may only be able to access some from a bank or an investment company that markets them. For example, Tangerine (a Canadian Bank) only makes their mutual funds available if you have a Tangerine online account. Tables speak stronger than words, so see below for a simple comparison of how transaction fees, expense ratios, and where you can purchase them differ between ETFs and mutual funds.


  Exchange Traded Fund Mutual Funds
Transaction Fee Usually around $5-$10 Usually none (but be careful)
Management Fee Less Can be a lot more
Available From Anywhere that sells stocks Some at any online brokerage, others only from the company or bank
Other - Usually require a minimum initial contribution


So what should you buy, ETFs or mutual funds? We make specific suggestions later, but in general Canadian mutual funds have much higher MERs and Canadian readers are advised to choose ETFs. On the other hand, American readers should consider buying mutual funds as their MERs are about the same as ETFs, but without the transaction fees.

Finally, let's talk a little bit more about the places you can actually purchase ETFs and mutual funds. All stocks and many mutual funds can be purchased from online brokers. What are online brokers? These are companies, including banks, that have created a website that allows you to tap into a stock exchange to make a trade. There are dozens of these available. Canadians are directed to this recent Globe and Mail article talking about the pros and cons of the various brokerages that exist in Canada. US citizens can see this Wikipedia page for a review of their options.

One final point, technically you can purchase stocks on any stock exchange, not just your specific country's. However, to do so, you would need to convert your currency into the specific country's currency with all the associated fees. Therefore, you're probably safest just sticking to your own exchange; and don't worry, there are plenty of ETFs and mutual funds holding international stocks that can be found in both the Canadian and US stock exchanges. In the next section, we'll talk about which specific ETF and mutual fund products you can purchase to obtain a balanced portfolio.

Which Funds to Buy


Below are a few major non-actively managed (i.e. no stock picking!) ETFs and mutual funds that you can buy to sample the total international stock market and the North American bond market. There are many products that we have not listed. This is not because we are biased, but because these funds charged much higher fees than comparable funds without any additional benefits.

For the bond proportion in our suggested 5- and 10-year investment portfolios, we present options for short (1-5 year) investment-grade (i.e. from corporations that aren't likely to go belly-up) corporate bond funds. For investment timespans of 1- and 2-years, purely corporate ultra-short funds are hard to come by, so government/corporate mixes are presented for these investment instruments. Note: Current (as of February 2020) ultra-short bond interest rates are comparable to many bank savings accounts. These might be the easiest and even cheaper (when fees are taken into account) option for your ultra-short bond allocation.

The funds are arranged by management fee to help you choose, but there is one other thing you should be aware of that can affect your potential return for the stock funds. Some stock products contain more stocks than others. More stocks may make a tiny difference, especially when sampling those from smaller companies, in improving both risk and return. Again, these changes are expected to be very small. For example, over a 12 year period from 1994 to 2016, the MSCI USA IMI index (2,494 large, medium and small companies) outperformed the MSCI USA index (922 large and medium companies) by ~0.4% per year.

You may read about products that are "hedged" to a certain currency. Currency-hedging tries to do away with increased risk from currency fluctuations (because international stocks are bought in the local currency) by using financial voodoo. However, sometimes currency fluctuations can help reduce risk by going in the opposite direction of a drop in return. So should you hedge? It turns out, for buying US stocks as a Canadian at least, that hedging doesn't make a difference with long investment time horizons, and that's why we haven't included these products.

All these options still giving you a headache? At the end of this section, we show what we would do after going over the math.

Bonds (US values current as of 2016, CA values current as of 2020)

Exchange Type Gov. or Corp. Bond Maturity Name Ticker MER Notes
US flag ETF Corp. + Gov. Ultra-Short SPDR SSGA Ultra Short Term Bond ETF ULST 0.20% -
US flag ETF Corp. + Gov. Ultra-Short iShares Short Maturity Bond ETF NEAR 0.26% -
US flag ETF Corp. + Gov. Ultra-Short PIMCO Enhanced Short Maturity Active Exchange-Traded Fund MINT 0.36% -
US flag Mutual Fund Corp. + Gov. Ultra-Short Vanguard Ultra-Short-Term Bond Fund Admiral Shares VUSFX 0.12% minimum initial contribution: $50,000; not technically ultra-short, has a proportion of 1-3 year bonds as well
US flag Mutual Fund Corp. + Gov. Ultra-Short Vanguard Ultra-Short-Term Bond Fund Investor Shares VUBFX 0.20% minimum initial contribution: $3,000; not technically ultra-short, has a proportion of 1-3 year bonds as well
CA flag ETF Corp + Gov. Ultra-Short iShares Premium Money Market ETF CMR 0.28% -
US flag ETF Corp. Short iShares 0-5 Year Investment Grade Corporate Bond ETF SLQD 0.08% -
US flag ETF Corp. Short Vanguard Short-Term Corporate Bond ETF VCSH 0.10% -
US flag ETF Corp. Short SPDR Barclays Capital Short Term Corporate Bond ETF SCPB 0.12% -
US flag Mutual Fund Corp. Short Vanguard Short-Term Corporate Bond Index Fund Admiral Shares VSCSX 0.10% minimum initial contribution: $10,000
CA flag ETF Corp. Short Vanguard Canadian Short-Term Corporate Bond Index ETF VSC 0.11% -
CA flag ETF Corp. Short BMO Short Corporate Bond Index ETF ZCS 0.11% -
CA flag ETF Corp. Short iShares Core Canadian Short Term Corporate + Maple Bond Index ETF XSH 0.10% -

Stocks (US values current as of 2016, CA values current as of 2020)

Exchange Type Market Name Ticker MER Stock # Notes
US flag ETF US Schwab U.S Broad Market ETF SCHB 0.03% 2,018 -
US flag ETF US Vanguard Total Stock Market ETF VTI 0.05% 3,620 -
US flag Mutual Fund US Fidelity Total Market Index Fund FSTVX 0.045% 3,436 minimum initial contribution: $10,000
US flag Mutual Fund US Vanguard Total Stock Market Index Fund Admiral Shares VTSAX 0.05% 3,750 minimum initial contribution: $10,000
US flag Mutual Fund US Schwab Total Stock Market Index SWTSX 0.09% 2,463 minimum initial contribution: $1,000
US flag Mutual Fund US Vanguard Total Stock Market Index Fund Investor Shares VTSMX 0.16% 3,620 minimum initial contribution: $3,000
US flag ETF World excl. US Vanguard Total International Stock ETF VXUS 0.13% 6,041 -
US flag ETF World excl. US iShares Core MSCI Total International Stock ETF IXUS 0.14% 3,308 -
US flag Mutual Fund World excl. US Fidelity Total International Index Fund FTIPX 0.11% 2,126 minimum initial contribution: $10,000
US flag Mutual Fund World excl. US Vanguard Total International Stock Index Fund Admiral Shares VTIAX 0.12% 6,041 minimum initial contribution: $10,000
US flag Mutual Fund World excl. US Vanguard Total International Stock Index Fund Investor Shares VGTSX 0.19% 6,041 minimum initial contribution: $3,000
CA flag ETF Canada Vanguard FTSE Canada All Cap Index ETF VCN 0.06% 200 -
CA flag ETF Canada iShares Core S&P/TSX Capped Composite Index ETF XIC 0.06% 233 -
CA flag ETF Canada BMO S&P/TSX Capped Composite Index ETF ZCN 0.05% 236 -
CA flag ETF US iShares Core S&P U.S. Total Market Index ETF XUU 0.10% 3,668 -
CA flag ETF US Vanguard U.S. Total Market Index ETF VUN 0.16% 3,479 -
CA flag ETF World excl. Canada iShares Core MSCI All Country World ex Canada Index ETF XAW 0.22% 8,933 contains US stock, take this into account when calculating total proportion of US stock in your portfolio
CA flag ETF World excl. North America BMO MSCI EAFE Index ETF ZEA 0.22% 921 -
CA flag ETF World excl. Canada Vanguard FTSE Global All Cap ex Canada Index ETF VXC 0.26% 10,657 contains US stock, take this into account when calculating total proportion of US stock in your portfolio

Our suggestions for Canadians

Ultra-Short Bonds Short Bonds Canadian Stock US Stock International Stock
High Interest Bank Savings Account VSC (Vanguard ETF) ZCN (BMO ETF) XUU (iShares ETF) XAW (iShares ETF)*

*Has US component, ensure to take this into account


Our suggestions for Americans

Initial Investment Ultra-Short Bonds Short Bonds US Stock International Stock
<$10,000 High Interest Bank Savings Account SLQD (iShares ETF)* VTSMX** (Vanguard Mutual Fund) VGTSX** (Vanguard Mutual Fund)
>$10,000 High Interest Bank Savings Account VSCSX (Vanguard Mutual Fund) FSTVX or VTSAX (Fidelity or Vanguard Mutual Fund) FTIPX or VTIAX (Fidelity or Vanguard Mutual Fund)

*Once you've reached >$10,000 invested, convert to the lower cost VSCSX

**Once you've reached >$10,000 invested, convert to the lower cost Vanguard Admiral Shares


I bet you're now itching to buy some stocks and slowly watch them grow as you go grey, but there's one more thing you need to know about that we'll discuss next: rebalancing.

How to Rebalance Your Portfolio


Rebalancing is a key concept that you need to know about to effectively manage your collection of stocks. Let's say you're an American and have two stock ETFs that you initially bought with $10,000 of money that was just lazing around. You wanted 80% US and 20% International, so you initially bought $8,000 worth of SCHB and $2,000 worth of VXUS. You check back on your holdings a year later and behold, they have grown! SCHB is now worth $8,800, while VXC actually lost a bit and is now at $1,800. This gives a current proportion of 83% US and 17% International. What should you do? You may be tempted to buy more US stock because it's been doing so well, but don't be brash. Smart people have shown (warning, this link is for math lovers!) that if you periodically rebalance your portfolio to maintain the same proportion of assets (i.e. always keeping that 80% US and 20% International split), you will usually get a better average return with less risk in the end. Why is this? The over-performing US market may actually be overvalued at the moment, while the International market may be undervalued. Markets usually increase at the same rate, and if they're doing better or worse than each other, you can expect them to correct themselves in the near future.

So to rebalance the portfolio, we should sell some SCHB and buy some VXC. Or, if you have some money to contribute, invest a bit more than 20% this time around in VXC.

One other option for those who do not want to worry about rebalancing is to invest in a multi-component mutual fund or ETF containing the combination of bonds and stocks you'd like and to let them rebalance the portfolio for you. This convenience is at the expense of a higher MER. The best option for Canadians appears to be the iShares combined ETFs, which charge about 0.20% MER per year. Americans can check out Vanguard's selection of funds, most charging a very attractive 0.15% or so per year. Be careful if you go this route: some insitutions are charging more than 2% per year on their combined funds, which will really eat into your future earnings. Furthermore, none of these funds have the optimum mix of bonds and stocks we suggest.

We're just about done. The next section summarizes all that we've learnt.

Summary

1) Make Your Money Work!

Money lying around as cash is lazy money that will lose value due to inflation. You should put it somewhere where it can grow. You should also start saving your money as soon as possible.

2) Stocks > Bonds in the Long Run

Stocks have historically outperformed bonds over long time horizons with almost equal risk. If you're planning on retiring in 20 years or more OR if you are already retired and you expect to slowly deplete your funds over 20 years or more, you should probably invest your money in 100% stocks. If you need all your money in a few years, you might be best holding most of your money in ultra-short maturity corporate bonds or a bank savings account.

3) Diversify

Buy large collections of stocks (via ETFs or mutual funds) across the globe to maximize return and minimize risk. If you live in the US, you can try 80% US and 20% International. Canadians can try 30% Canada, 55% US and 15% International.

4) Don't Gamble

Buying a single stock at a time (that isn't a broad ETF) is high risk and is basically gambling. Even holding onto a collection of stocks for less than a decade or two is gambling. If you want to gamble, it's your money, but be aware of the considerable risk you are taking.

5) Rebalance

Try and keep the same proportion of assets through time.

6) Understand the Limitations of this Strategy

The above points assume that, overall, the future stock market will behave as it has in the past. Many believe it will; however, if you don't, you should not follow this strategy.

7) Start Investing

Click here for our suggested asset mixes, and here for the specific stock/bond funds we suggest you should buy.